This section summarises some of the key trends and patterns associated with accommodation for children in care, care leavers and those who are ‘entering’ care.

Child in Care Population

Numbers of children in care in Warrington rose sharply over a period of six years. From a low base of 232 in 2014, numbers increased to 401 children in care at the end of March 2018, matching the 2018 North West average rate of 90 children in care per 10,000 (0-17 year olds). This represented an increase of 73%. Access to appropriate accommodation and care for children and young people presented some acute challenges over this period.

There has since been a steady decline in the number of children in care. The numbers as of the 31st March 2019 were 385, and has now fallen to 364 at the end of March 2020.

Image
Children in care by year 2014: 232, 2015: 300, 2016: 346, 2017:381, 2018: 401, 2019: 385, 2020: 364

Since 2013-14, Warrington has had a high rate of children in care. The rate at the end of March 2020, is 81.6 per 10,000 and is higher than the latest published data for national and statistical neighbour averages. However, over the last 2 years our rate has dropped in comparison with other local authorities in the North West. We are now below the latest North West average of 94 per 10,000. Whilst our rate has decreased year on year since 2018, the rates of children in care per 10,000 for national, regional and statistical neighbours have all increased, bucking the national trend and closing the gap.

Image
Graph showing the amount of children in care per 10K.  2014: 52.8, 2015: 67.5, 2016: 77.8, 2017 85.4, 2018: 89.8, 2019: 87, 2020: 81.6

Warrington has now turned the curve and numbers entering care are at the end of March 2020, lower than the numbers being discharged. In part this is due to both a robust pre-proceedings process and a focus on the Discharge of Care Orders. A further reduction in overall numbers is anticipated through further increases in number of Discharge of Care Orders (COVID-19 permitting) to Special Guardianship Order or No Order. A locum solicitor and an additional SGO worker were appointed in 2020 to focus on this particular area of work.

Gender

For the last few years, Warrington has had a consistently higher proportion of males to females than our comparators, with a split of 57% to 43% in March 2020. Nationally and regionally, the gender balance of children in care has a higher proportion of males (56%) compared to females (44%).

Image
Graph showing the gender split of children in care. 2017 53 male and 47 female, 2018 58 male and 42 female, 2019 59 male and 41 female, 2020 57 male and 43 female

Due to the increasing number a member of the Safeguarding & QA team undertook an audit of cases in January 2020 of males entering care. The audit focused on 6 months from July to December 2019. 20 cases were audited in total. In the audit period 65% of children entering care were Male. The majority were aged 10-17 years of age. There was a peak of children coming into care in August. Abuse or neglect is the main precursor to young people entering the care system, with it being prevalent in 73% of cases. Of the 18 adolescent males that entered the care, only 4 were reported to be involved in criminal activity or exploitation. Others were due to being unaccompanied asylum seekers; issues with foster carers leading to placement move; Parents’ struggling with child’s mental/physical health; fabricated illness and abuse/neglect. The children were reported to have behavioural difficulties and challenging behaviour, the majority had a diagnosis of ADHD or autism.

Discussions have taken place with Advanced Solutions who are commissioned to offer a number of support services already to this cohort of children (Appendix A).

Ethnicity

In line with national and regional figures, 85% of Warrington’s children in care are of White British ethnicity. In Warrington, according to the latest published School Census, which collects the ethnicity of pupils in Warrington schools, 85.8% were recorded as being of white British origin.  This does present us with some challenges when we are placing children of other ethnicity or cultures.

At the end of 2020, there were 17 unaccompanied asylum-seeking children (UASC), 4.7% of the total children in care population. This is higher than the North West (3%) but lower than the national average (6%). This sub group are generally older (aged 16-18 years), boys, and are in need due to absent parenting. There were also 8 who qualified for Care Leavers status. Of these 17 USAC and 8 Care Leavers none were placed in Warrington as we could not source placements to meet their individual needs. They majority were placed in Greater Manchester region, with either an Independent Fostering Agency or in Supported Accommodation. Warrington are committed to supporting USAC and have agreed to continue to take children under the National Transfer Scheme. However, the provision of placements remains a challenge.

Image
unaccompanied asylum seekers. 2016:3, 2017:5, 2018:22, 2019:19, 2020:17

Age

At March 2020, the provisional data shows that the largest age group (46%) of children in care are aged 10-15 years; 20% are aged 16 years and over. There are 17% aged 5-9 years; the age group where our permanency planning is focused. Twelve percent of children in care are aged 1-4 years and 5% are aged under 1 year.

The proportion of the age group, 10-15 years, is somewhat higher than our comparators at 46%, with England and North West averages having a proportion of 39% and 40% respectively. This is due to our increase in children entering care from 2014 to 2018 who are now older. This does present additional challenges for finding suitable accommodation, particularly as these children move to the 16+ category and options can become more limited.

Image
Children in care on 31 march. under1 5%, between age 1-4 12%, between 5-9 17%, between 10 and 15 46%, 16+ 20%

Admissions and Discharges

Image
Graph charting admissions and discharges which range from 100 in 2012 to 134 in 2020

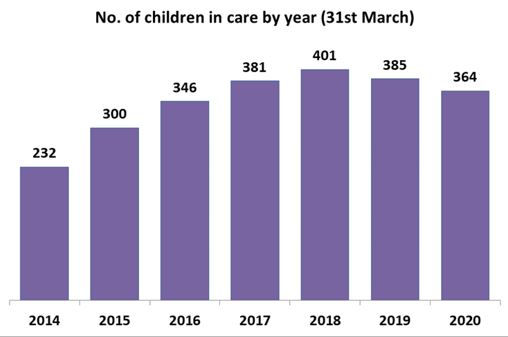
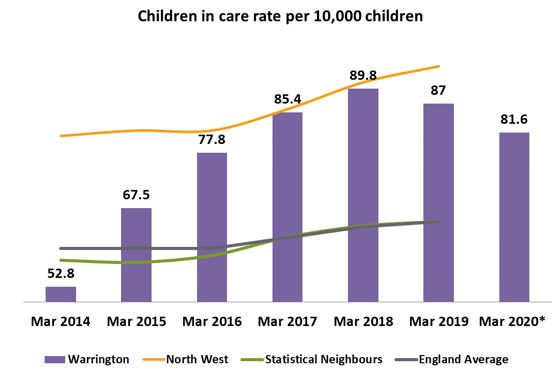
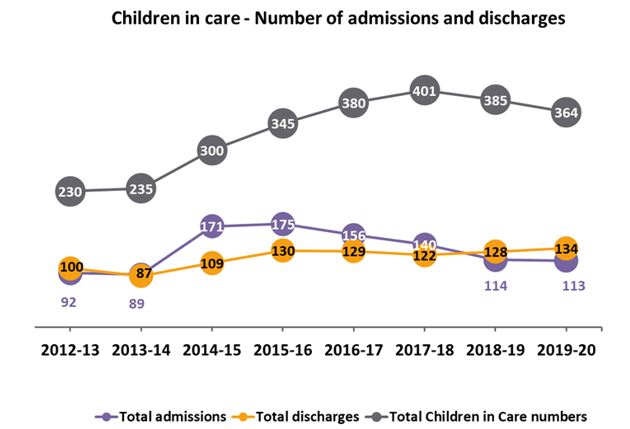
The graph above highlights the admission and discharge numbers since 2012/13 and illustrates the overall sharp increase in numbers between 2013 and 2018. Changes to the court process, the impact on practice of high profile abuse cases, increased accountabilities for Local Authorities around homelessness and young offenders, along with a national and regional increases, impacted on figures.

Since 2018 the number of children entering care had seen a year on year downturn, whilst in parallel the number of children being safely discharged from care has increased. This has led to an overall reduction in our Children in Care numbers in Warrington. This reduction is due to accumulation of a number of factors, including a robust early help offer, adequately resourced edge of care service, a focus on good quality pre-proceedings work and legal permanence for children exiting our care.

However, we still continue to anticipate pressure in relation to a number of areas including:

  • An increase in court directed Mother and Baby Placements.
  • Accommodation for young people with high level risk to self or others and needing semi- secure, therapeutic and or solo placements in residential settings.
  • Sourcing family placements for adolescents and large sibling groups
  • Provision for children with physical and learning care needs and those that may require medical care
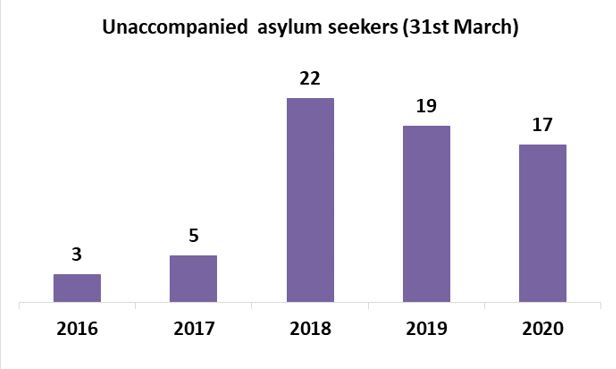
  • Asylum seekers and children of migrant worker families.
  • Supported Provision for 16 to 18 year olds and care leavers up to 21 years old and in some   instances 25.

Admission by age

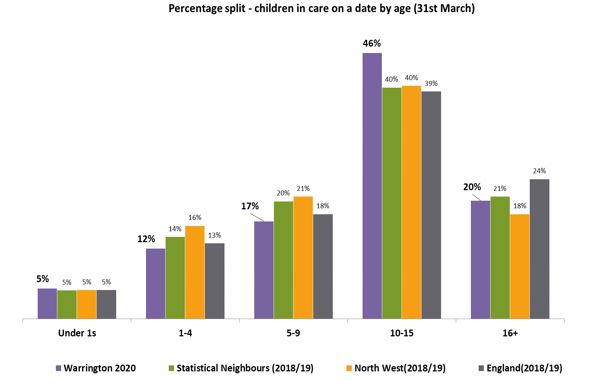
According to the 903 2020 data, the percentage of babies under a year old coming into care was higher (25%), than national and regional averages (20%). Warrington also has slightly higher proportions of 1-4s admitted to care at 23% compared to 17% in England, and has broadly similar proportions of 5-9s (17%).

Our admissions of 10-15 year olds is lower (25%) than previous years, and lower than national (27%) and regional (26%) figures. Admissions of those aged 16+ are lower (11%) than the North West (14%) and the England average (20%). This is positive and can be partly attributed to the work taking place via our ‘Edge of Care’ short break service, who between April and October 2019 diverted 13 children from entering care. In the next 2-3 years we should start to see the impact of these changes in our overall Children in Care and Care Leavers figures. 

There is acknowledgement that outcomes among first time entrants to care as teenagers can be poor, with a marked propensity to return to their households and communities once care episodes have concluded. There is evidence that adolescent entrants to the care system are more likely to experience multiple placements. They tend more often to experience disruption. They have poorer educational outcomes and a concomitantly raised likelihood of struggling in the labour market when they leave care.
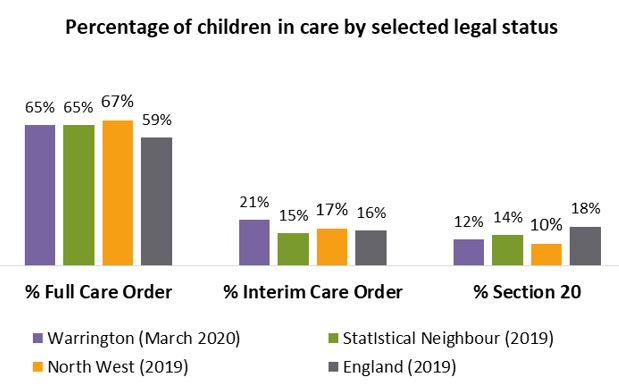
Legal Status

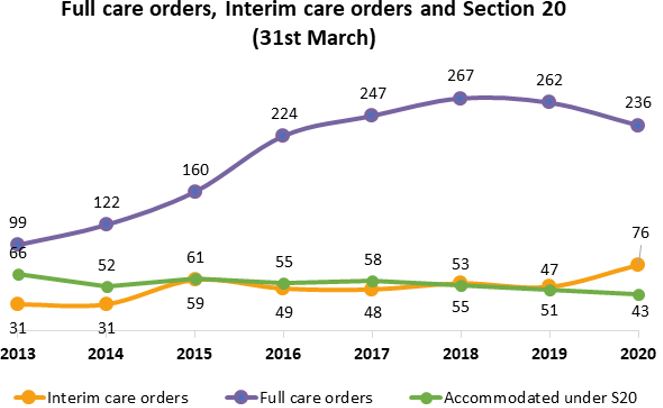
The status awarded through the legal process to children in care is significant, as it does affect the options for accommodation in the short, medium and longer term. Along with a decrease in children in care numbers Warrington has seen a decrease in the number of Full Care Orders from 267 in March 2018 to 236 in March 2020. Over the last 12 months there has been a significant increase in the number of children subject to Interim Care Orders (ICO) from a low of 47 in 2019 to a high of 76 in 2020. Over the past 5 years, section 20 arrangements had remained stable, but we are now starting to see a decrease in numbers; from 55 in 2018 to 43 in 2020. This reduction in section 20 arrangements and a marked increase in ICOs supports the hypothesis that there is less ‘drift and delay’ in decision making when cases need to be placed before the court, which in turn leads to early permanence decisions for our children in care.

Image
Graph showing care order data, full care orders, interim care orders and section 20 between 2013 - 2020

Over the last 2 years there has been a slight shift in the legal status of our Children in Care. Whilst we have exactly the same percentage of children subject to Care Order (65%, as we did in 2018) the latest published data shows that we now have 6% more children subject to ICOs (21% in 2020 compared to 15% in 2018) and 2% less children accommodated under Section 20. The increase in children subject to Full and Interim Care Orders is in line with our commitment to improve our pre-proceedings processes and prevent drift in relation to permanency planning.

Image
Graph showing percentage of children in care by legal status, full care orders 65%, interim care orders 21% and section 20 12%

In 2018 there were 48 children placed at home with their parent/s whilst subject to a Care Order. As of the 31st March 2020 this had been reduced to 39; 29 Full Care Orders. Eleven of these children are now 16/17 years old and will move out of care when they turn 18. Ten have remained at home during care proceedings, by order of the court. Children who have been at home for longer than 12 months are tracked via a panel chaired by our Head of Service to ensure there is no drift in relation to discharging the Care Order.

Placed Close to Home

Provisional data (31st March 2020) shows that just over 55% of children in Warrington are placed inside the borough. The England average is 51% and the North West 57%, and Warrington is just below our comparators.  Warrington is a small authority however, and this measure is not comparable with many other larger boroughs. Many children placed out of borough are just outside the Warrington boundary so remain close to their original home, family and friends.

The majority of children (88.2%) are placed within 20 miles of the child’s home. For those placed within 20 miles but outside the boundary, proportions have increased from 24% to 32.4%.

For children in care placed outside LA boundary and more than 20 miles from where they used to live, provisional data indicates that there are 11.8% in Warrington, a slight increase on 10% in the previous year. This compares to 15% in England and 11% in the North West.

Stability

Image
graph showing children who have had more than 3 placements in the last 12 months. 2014-15 13, 2015-16 10, 2016-17 10, 2017-18 14, 2018-19 12, 2019-20 9.

Short-term stability has improved over the past two years and now stands at 9.3% (34) children in care having had three or more placements during the year, below the England rate of 10% and below the rate of our Statistical Neighbours.

Similarly, long-term stability has improved over the past two years with 66.7% of children in the same placement for over 2 years, and increase since the previous two years.

Image
Graph showing the number of children who have been in the same placement for more than 2.5 years 2014-15: 70, 2015-16: 72, 2016-17: 76, 2017-18: 65, 2018-19; 65, 2019-20: 67

Good rates of short and long term stability are implicit in helping us to manage the placement market and increase our sufficiency, as well as (of course) improving the outcomes for our children.